Overview
The US Truckload (TL) market is a dynamic ecosystem that constantly evolves in response to economic, regulatory, technological, and weather disruptions. In this post, we’ll provide an update on the current state of the US TL market, highlighting key trends and insights that can help shippers, carriers, and other stakeholders navigate the road ahead.
The US economy is currently facing a number of significant challenges and opportunities. The residual impact of COVID-19 continues to have major impact on the economy, with supply chain disruptions, labor shortages, and inflationary pressures. The Federal Reserve’s monetary policy and interest rate decisions continue to play a crucial role in shaping our economic outlook. Additionally, geopolitical tensions and global trade dynamics are influencing market sentiment and investment decisions. As we closely monitor these developments, below we will provide updates on their implications for the US economy and the truckload market.
Demand & Consumer Behavior
- Economic Recovery:
- The US economy is on the path to recovery (“Soft Landing”), with consumer spending playing a crucial role. As consumers regain confidence and resume their spending habits, the demand for goods and services is increasing.
- Consumer spending increased 0.7% in December, stronger than the 0.5% estimate. Personal income growth edged lower to 0.3%, in line with the forecast.
- Shift in Spending Patterns:
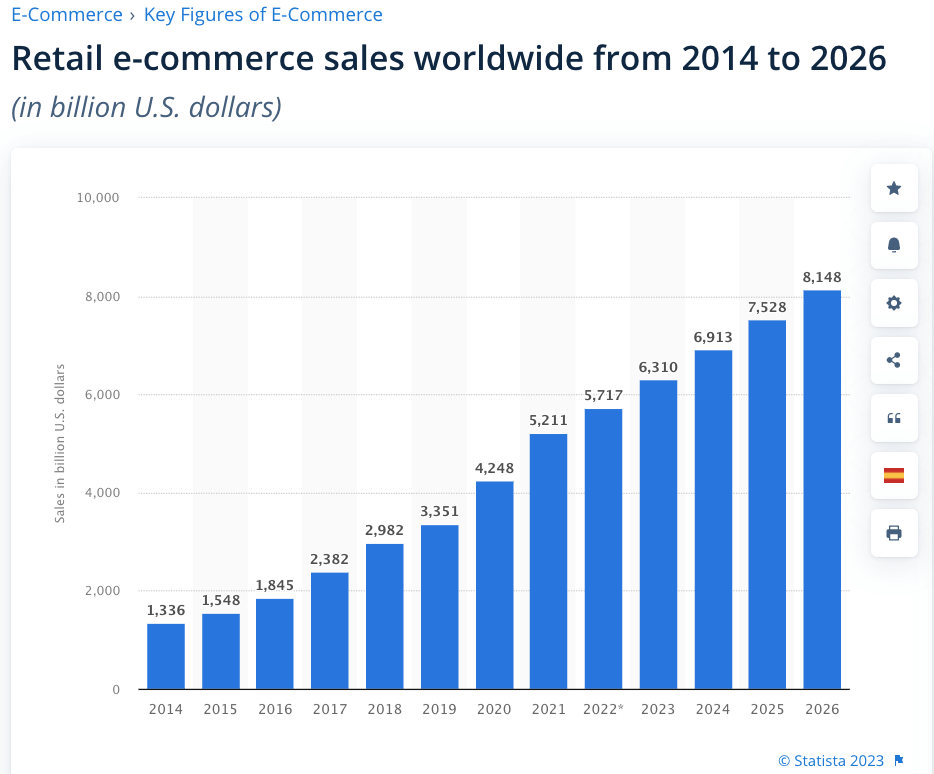
- The pandemic has led to a shift in consumer spending patterns, with a greater emphasis on e-commerce and home delivery services. This has resulted in increased demand for truckload transportation, as companies strive to meet the growing demand for goods.
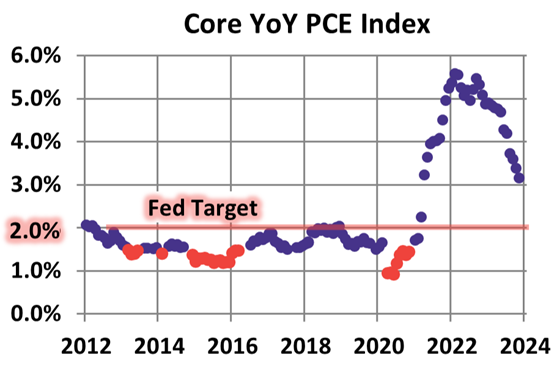
- Inflationary Pressures:
- Rising inflation has also impacted consumer spending, with higher prices leading to reduced purchasing power. This has the potential to dampen consumer demand and, consequently, truckload demand.
- The core personal consumption expenditures price index for December, an important gauge for the Federal Reserve, increased 0.2% on the month and was up 2.9% on a yearly basis.
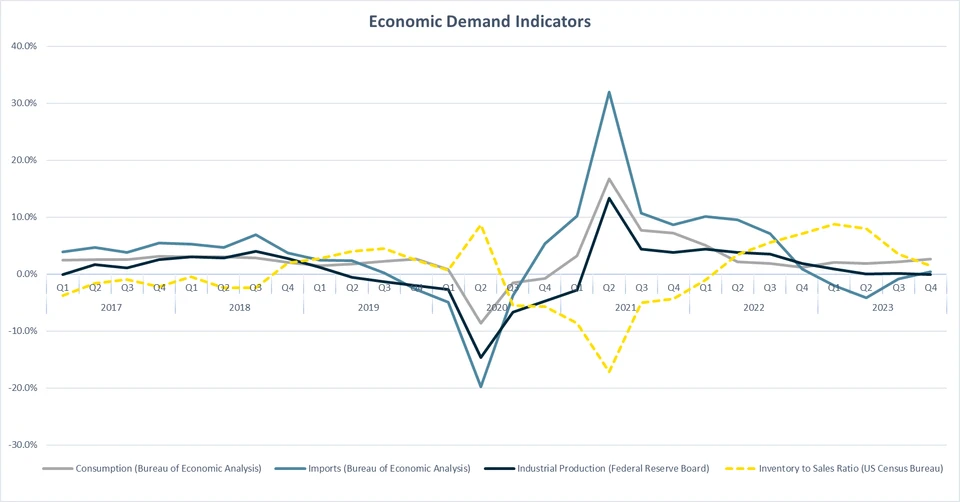
Q4 2023 Y/Y % Change – Economic Demand Indicators
| Consumption | Imports | Industrial Production | Inventory to Sales |
|---|---|---|---|
| 2.6% | 0.004% | -0.0008% | 1.5% |
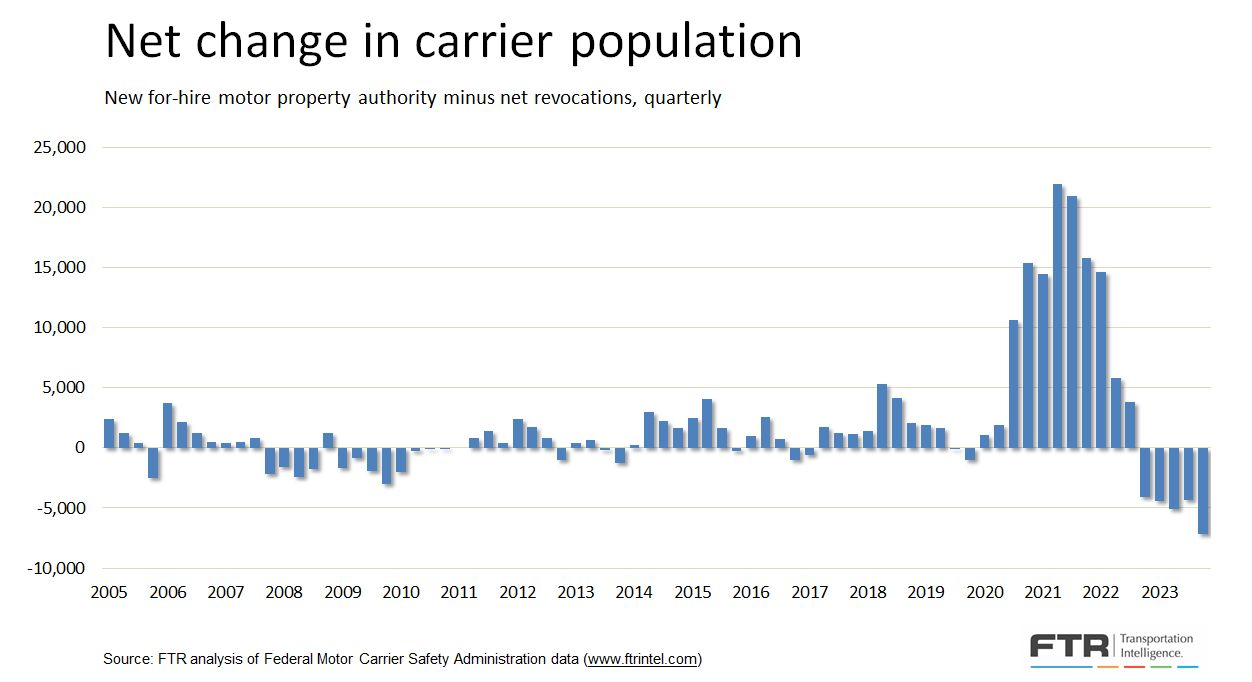
Supply of Capacity
According to Avery Vise, VP of Trucking at FTR Transportation Intelligence, “The number of for-hire trucking firms exiting the market in the fourth quarter of 2023 was barely higher than in the third quarter, but the number of new entrants continued to fall sharply. The result was the largest net decrease in the carrier population ever in a quarter. Changes in the carrier population tell only part of the capacity story, however. For starters, the number of active carriers remains far higher today than it was before the pandemic. Perhaps more important, payroll employment for truckload carriers has remained high as many larger carriers have hired drivers displaced by failing small operations.”
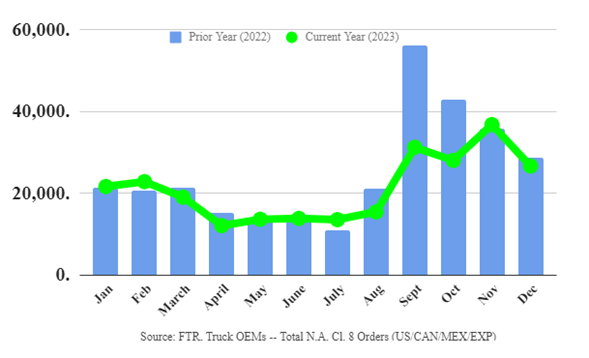
FTR – Total N.A. CL 8 Orders: December came in at 26,620 units, which was 26% below November and down 6% Y/Y.
Market Forecast
Trends to Watch
- Capacity Crunch: The US truckload market is about to experience a capacity crunch, with demand outstripping supply. This is due to a combination of factors, including the ongoing driver shortage, rising fuel prices, and increasing demand for trucking services.
- Rising Freight Rates: As capacity begins to crunch, freight rates will rise. From 2020-2021 (COVID-19) shippers were facing higher costs, and carriers were enjoying increased profitability. Now that we’ve been in a deflationary market since the beginning of 2022, carriers are running low on capital putting pressure on capacity remaining relevant in the market.
- E-Commerce Boom The rapid growth of e-commerce continues to have a significant impact on the truckload market. With more consumers shopping online, there is a growing need for efficient and reliable transportation services to deliver goods to their doorsteps.
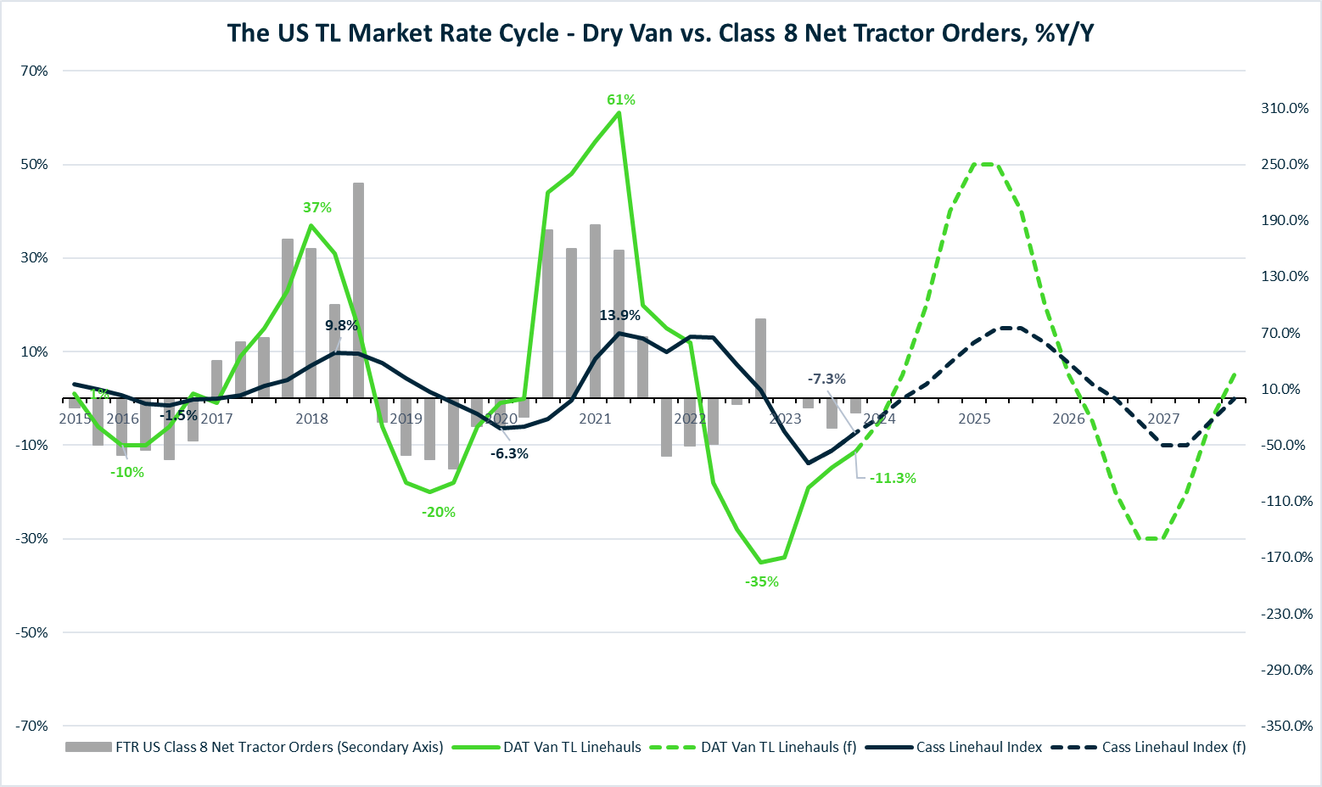
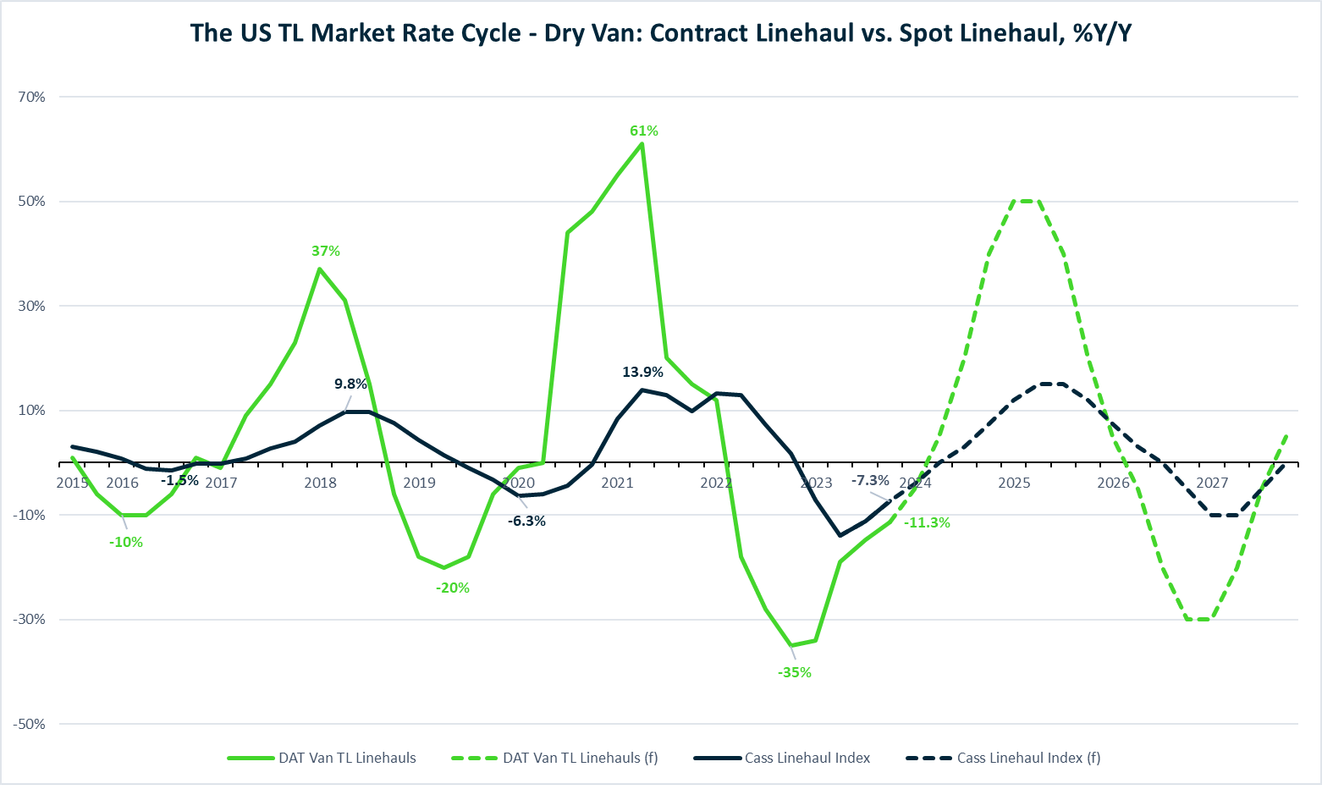
Q4 2023 Actual
- CASS -7.3% Y/Y
- DAT -11.3% Y/Y
Contract Rates Forecast
- Exiting deflationary period
- Continued pressure on excess capacity through Q1
Spot Rates
- Fading towards equilibrium
- Inflationary in Q2 – Beginning of next market capacity cycle
- Q1 ’25/Q2 ’25 Peak Inflection Point
| Potential Accelerators | Potential Decelerators |
|---|---|
| Successful ‘soft landing’ for the US Economy Reversal higher in the direction of diesel prices Dramatic Increases in the rate of supply exiting market One or more major weather event | Delay in ‘soft landing’ for the US Economy Government Intervention to regulate rates or otherwise artificially prevent natural equilibrium Another major leg down in diesel prices |
Dry Van
As we embark on 2024, the capacity levels of large truckload carriers are continuing to contract, following an unprecedented period of expansion. These levels are now back to approximately the same level they were at the close of the second quarter in 2020, a time when the pandemic drastically altered the economy and demand plummeted. In January, the average linehaul rate in the top five spot market states (CA, GA, IL, NJ, and TX) stands at $1.72/mile, mirroring the figure from the same deflationary period in 2019.
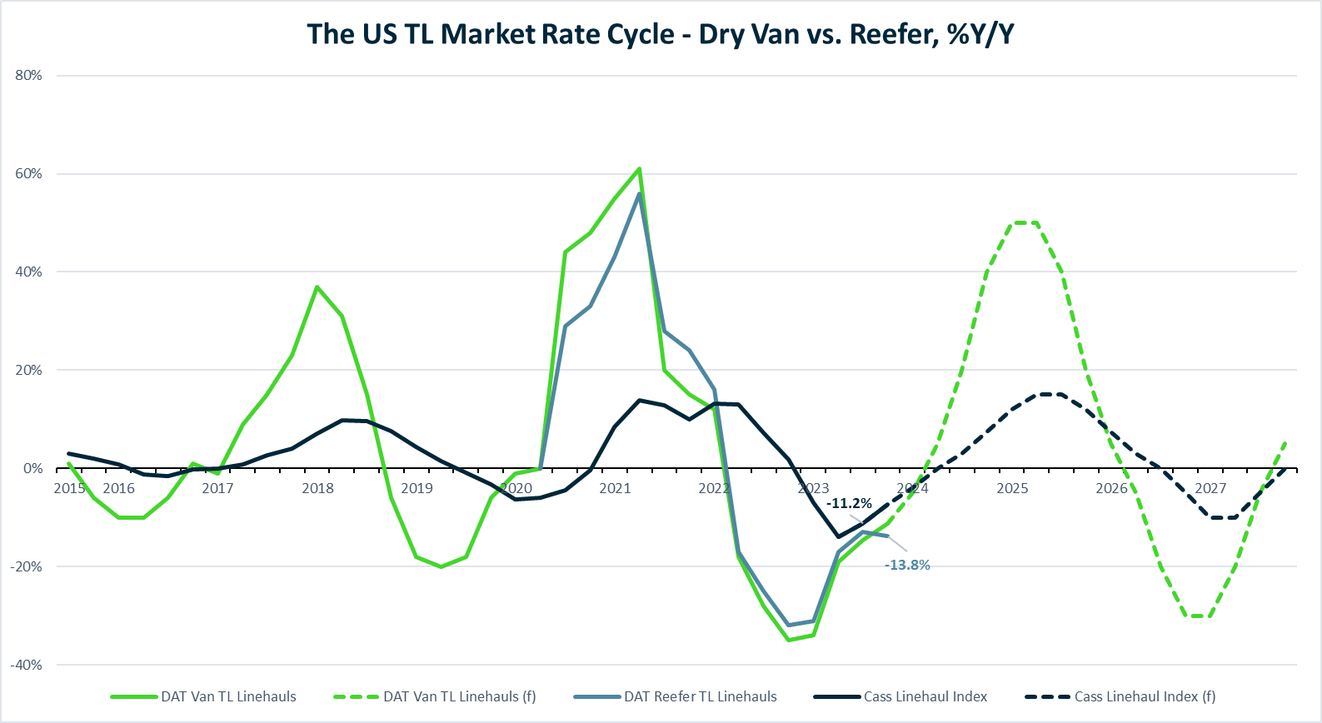
Reefer
The cold season typically runs from October to March, with some of the coldest temperatures occurring in the northeast, upper Midwest, Pacific Northwest, and Canada. Shippers are increasingly incorporating freeze protection or protect-from-freeze (PFF) clauses into their bills of lading to prevent traditional dry freight from freezing, increasing the demand for reefers. At $2.00/mile in February, linehaul rates have decreased by $0.08/mile in the last month and compared to last year, reefer rates were $0.31/mile lower Y/Y in Q4 2023.
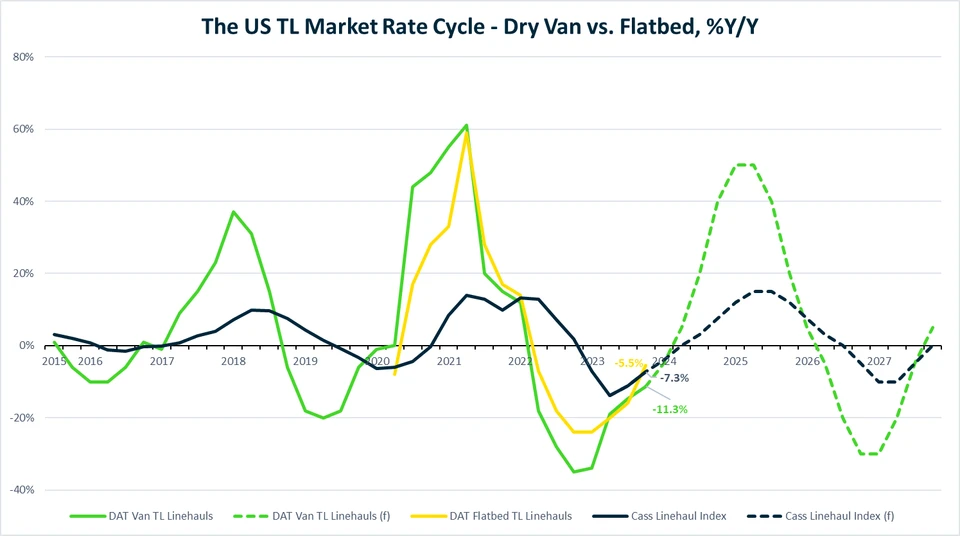
Flatbed
Flatbed demand stayed subdued in December, influenced by a decreasing demand for oil and gas exploration and reduced construction of single-family housing. The most recent data from the U.S. Census Bureau reveals that single-family starts experienced a significant decline in December, plummeting by 8.6% in comparison to November. Although the rate of single-family home construction remains 16% higher than the previous year, it has dropped by 20% compared to the record high achieved in December 2020. Since the start of this year, flatbed spot rates have increased by $0.05/mile, although remain deflationary in Q4 being down $0.11/mile Y/Y.

Contributor
Mike Beckwith
Vice President, Brokerage
mbeckwith@freightplus.io
Mike Beckwith oversees the strategic development and execution of the company’s brokerage services, offering customized solutions to clients across various industries and markets. With over 10+ years of experience in the transportation and logistics sector, he has a deep understanding of the challenges and opportunities in this dynamic and competitive field. Mike also enjoys contributing to the professional development and growth of the next generation of leaders in the industry, as a member of the Young Executive Committee at TIA and the CPE Advisory Board at The University of Tennessee at Chattanooga for their Southeast Logistics Academy.
Contact us for more information on the domestic transportation market or if you’d like to learn more about FreightPlus.
For Shippers
Are you looking to connect with a sales representative?

