Overview
The US TL Market, an approximately ~$900 billion industry, has roughly 1 million for-hire carriers with over 7 million shippers. Being a massively fragmented and dynamic marketplace, its complexities can be challenging to understand and navigate. Not only for shippers but carriers as well. In this type of environment, you will rarely see a balance between supply and demand. This creates consistent price volatility that can be experienced across all facets of the industry.
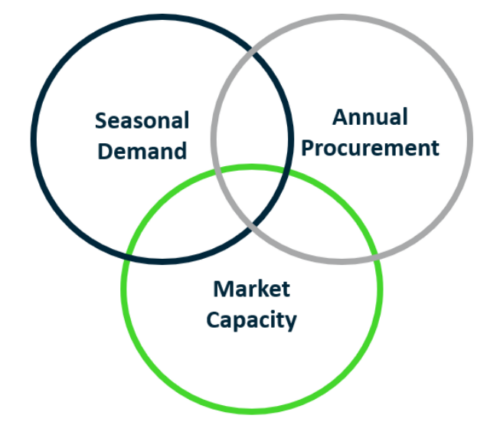
To understand the economics behind transportation, you must first understand which cycles play an integral role in the volatile changes to supply and demand. Every year the US TL Market experiences 3 distinct cycles that congruently interact to set the table for the shipping industry. While seasonal demand and annual procurement take place annually, market capacity takes place over the course of a ~3-year period.
- Seasonal Demand: Produce, Construction & Peak (Holiday)
- Annual Procurement: RFPs, Establishing Budgets & Contracted Pricing
- Market Capacity: Supply of Trucks vs. Demand of Shipments
Understanding Supply (Truckload Carriers)
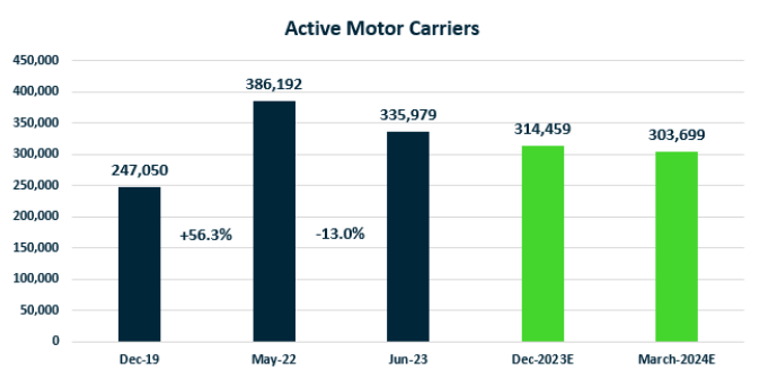
According to FMCSA there were ~400,000 for-hire carriers at the end of 2022. Of these for-hire carriers, over 4 million Class 8 trucks are being operated. Even though there are several large truckload fleets that operate 4000+ trucks, no single provider controls enough market share to directly dictate the rates a shipper will pay. With the barriers of entry being very low, it is easy for new players to enter the market in just a few short months.
- 99% of asset-based companies operate with less than 100 power units
- 89% of asset-based companies operate with 5 power units or less
- The top 7 truckload carriers by size account for less than 7% of the total TL Market
What Affects Supply?
- Carrier Finances
- Regulations
- Driver Retention
- Weather / Acts of God
Understanding Demand (Shippers)
The US shipping community consists of raw material suppliers, manufacturers, wholesalers, distribution centers (DCs) and retailers to name a few. With over 7 million shippers in the US TL Market, the demand side of the equation is as fragmented as the supply side. Shipper demand for truckload is driven from consumer behaviors that are consistently changing based on a wide array of factors. These factors are namely psychological, social culture, personal and economical.
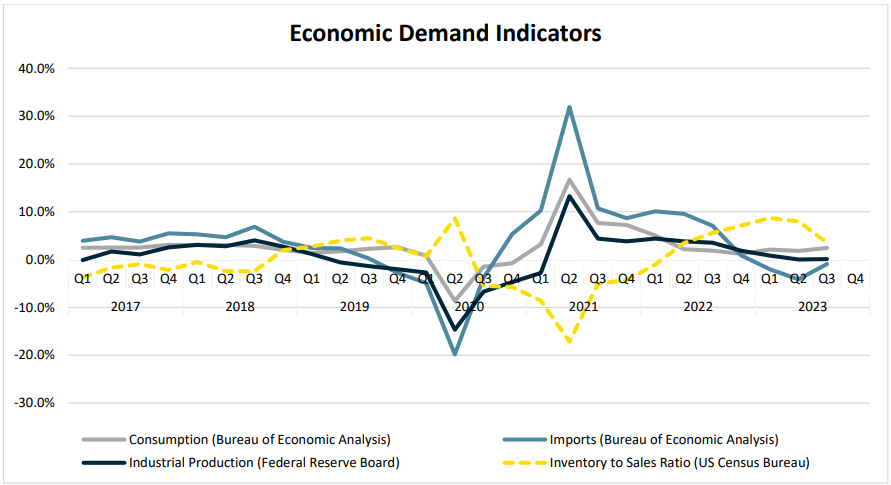
What Affects Demand?
- Consumer Spending
- Inventory Levels
- Industrial Production
- Imports
- Economic Factors
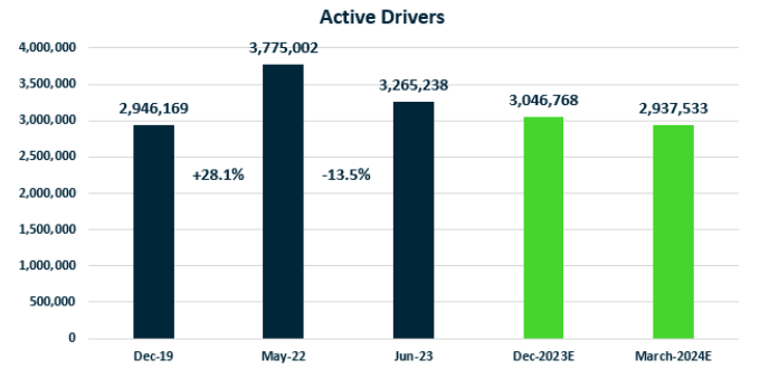
Strong consumer spending and depleting inventory levels will likely stage manufacturing activity and growth in freight demand in the coming months. Along with carriers continuing to exit the market with weak truck orders, this will set the stage for an inflationary market in 2024 where spot rates will accelerate upwards and contract rates will follow suit.
Market Capacity Cycle Fundamentals
The US shipping community consists of raw material suppliers, manufacturers, wholesalers, distribution centers (DCs) and retailers to name a few. With over 7 million shippers in the US TL Market, the demand side of the equation is as fragmented as the supply side. Shipper demand for truckload is driven from consumer behaviors that are consistently changing based on a wide array of factors. These factors are namely psychological, social culture, personal and economical.
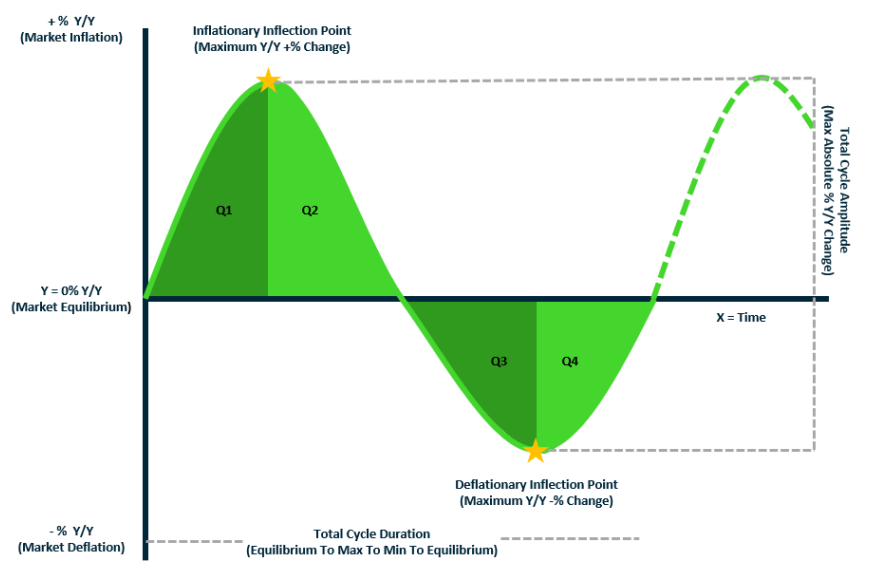
Cycle Duration (~3 years) – Inflation, Deflation then back to equilibrium (0% Y/Y Change)
Inflation vs. Deflation – The measurements of how more/less expensive rates become.
What Happens During Inflation?
- Demand (Shipments) Exceeds Supply (Capacity)
- Routing Guide Exposure – Decreased acceptance on contracts
- Increased Spot Opportunities
- Rates Increase Year-over-year (Y/Y)
- Supply Enters the Market
What Happens During Deflation?
- Supply (Capacity) Exceeds Demand (Shipments)
- Routing Guides Hold – Increased acceptance on contracts
- Decreased Spot Opportunity Activity
- Rates Decrease Year-over-year (Y/Y)
- Supply Leaves the Market
Market Capacity Cycle Fundamentals Continued
What is CASS?
- Freight accounting company
- Captures $30B in data
- A measure of pure truckload cost and does not include accessorial charges like detention and fuel.
- Proxy for the contract market
What is DAT?
- US-based freight exchange service and provider of transportation information serving North America.
- Captures $118B in actual freight payments
- Load board / Quoting tool
- Proxy for spot market
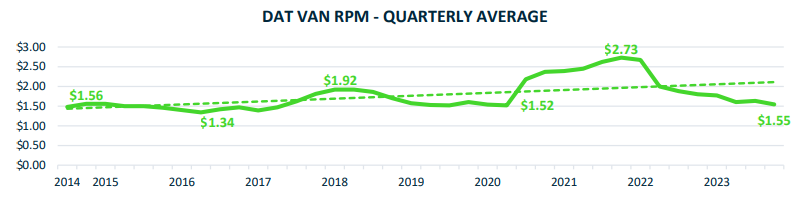
The next step to understanding the US TL Market is to understand how we interpret the raw data. By looking at the DAT VAN RPM – QUARTER AVERAGE graph below, you will see that like most things in the US economy, the RPM experiences the same 4% inflation over-time. However, no directional pattern is shown for whether it will be above or below that 4% inflation trendline.
Once you take this same data set for the DAT RPM and begin to look at the Y/Y % variance is when you begin to see this pattern emerge. (Second Graph) A pattern resembling what you see on an ECG heartrate monitor, representing the ‘heartbeat’ of the US TL Market.
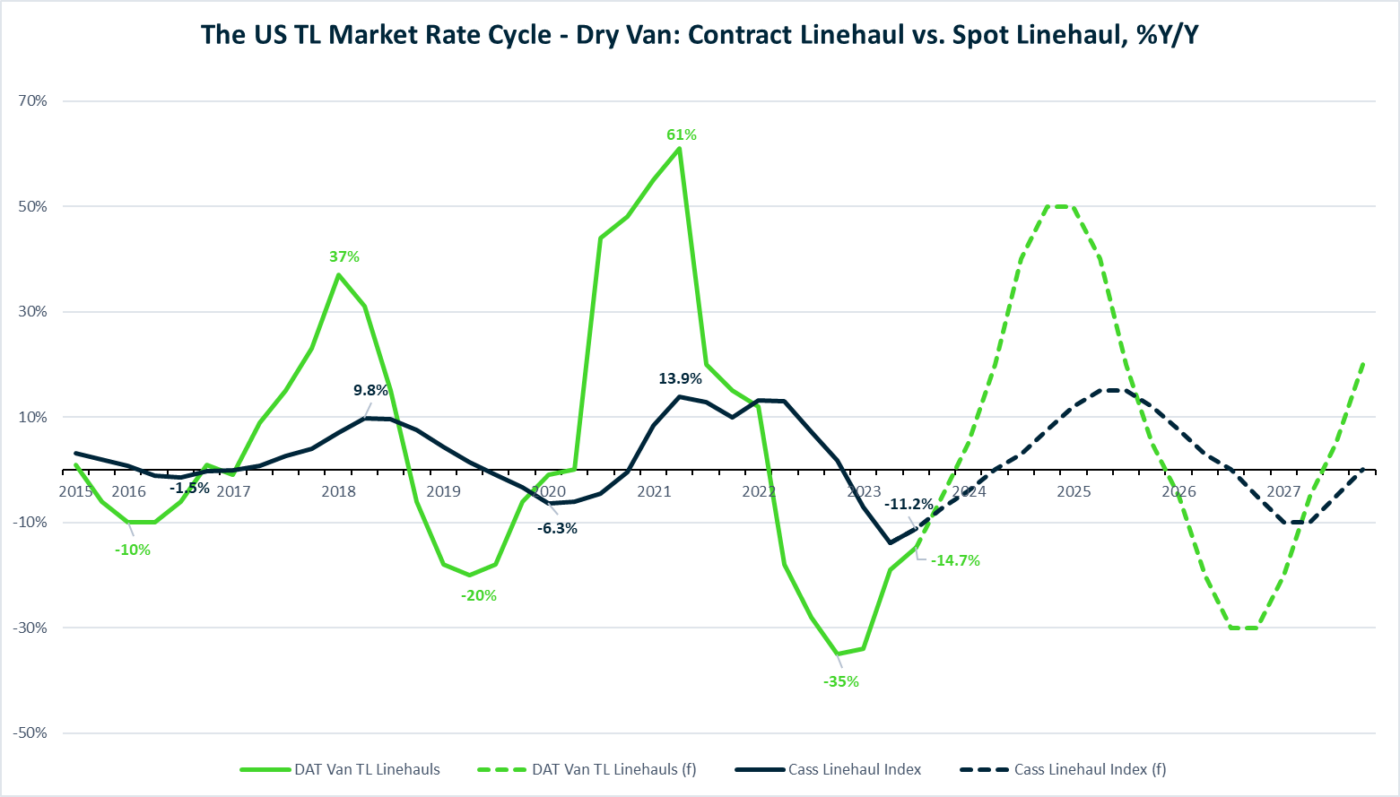
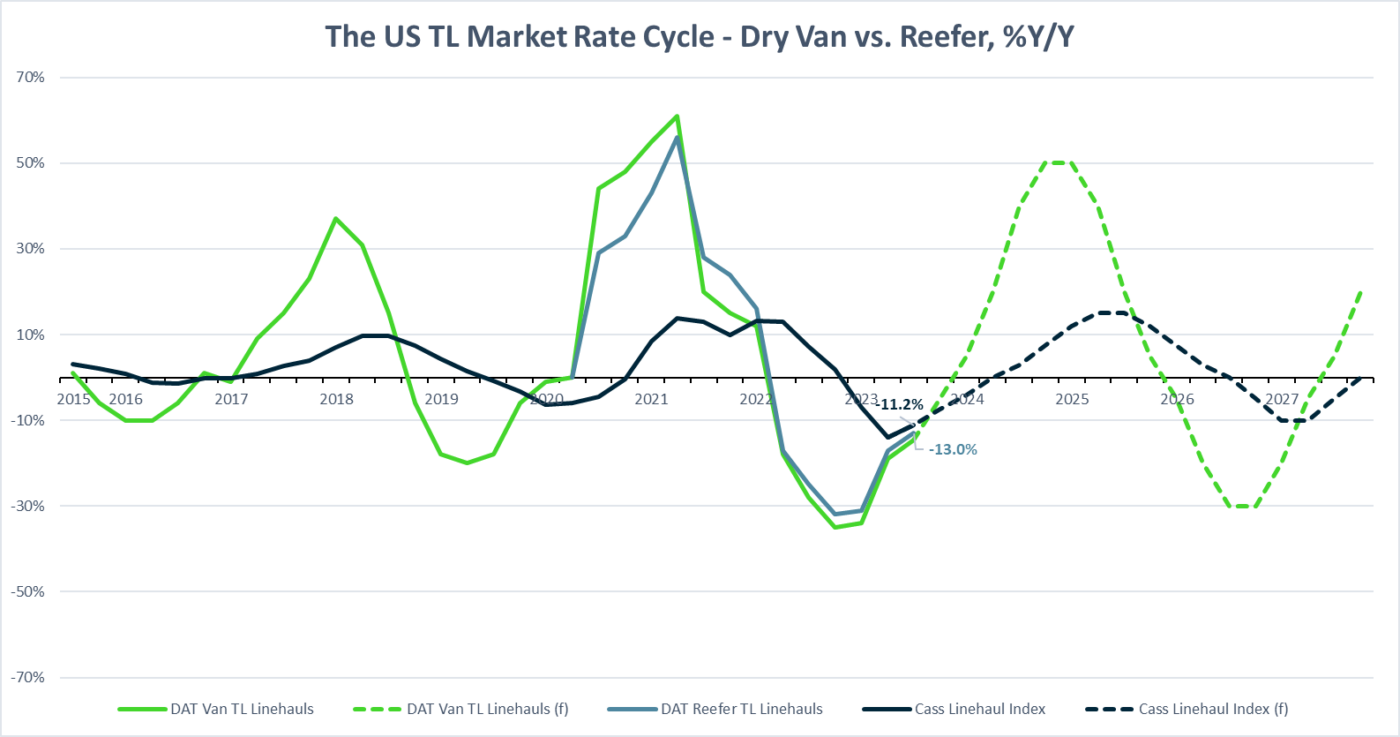
Market Capacity Cycle – Dry Van
Now that we’ve built upon your understanding of how to interpret these graphs from the
contract (CASS) proxy vs. the spot market (DAT) we can take the next steps to discuss where we’re currently at and where we’re heading.
This all begins with the consumer. Unlike your typical deflationary period, we’ve seen the current US TL Market interact with a post COVID era, a banking crisis, with changing consumer conditions which have been riding on the labor markets. While it turns out the 2023 economic story was not a recession, there’s been a disconnect between consumer sentiment and behavior.
Consumer Condition
- Credit Utilization Climbing
- Savings Rates Mirror 2009
- High Inflation
- Elevated Interest Rates
- Increasing unemployment rates
Looking forward, the forecast model tells us to expect rates to break Y/Y inflationary in Q1 2024. From there, they run +30-40% Y/Y higher on average from current levels through 2024 while peaking at ~60% by Q3/Q4 2024.
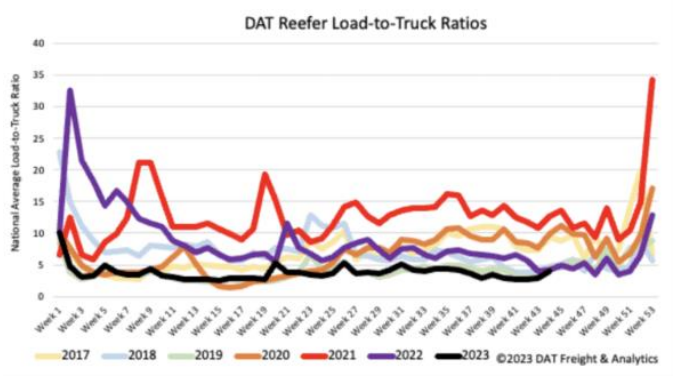
Market Capacity Cycle – Reefer
Boosted by Christmas trees, Fall produce, fresh turkeys, and pork shipments ahead of
Thanksgiving, reefer load posts (LP) surged by 24% w/w, slightly higher than the increase we have typically seen in prior years. Carrier equipment posts (EP) were down 11% w/w, resulting in last week’s reefer load-to-truck ratio (LTR) spiking by 40% to 3.98. However, this is still the lowest reefer LTR in seven years. At $1.92/mile, reefer linehaul spot market rates are $0.16/mile lower than last year and around $0.07/mile higher than in 2019.
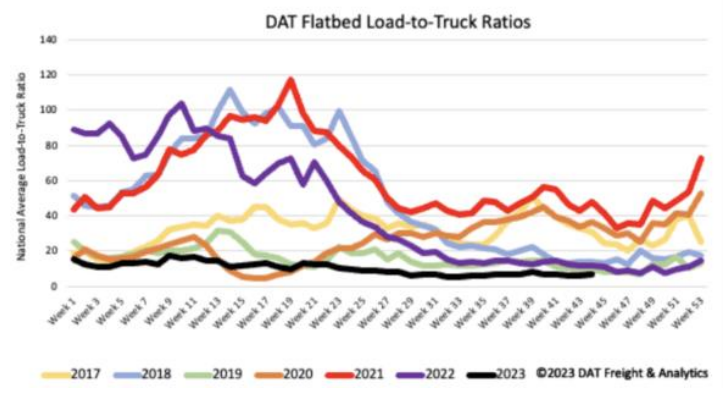
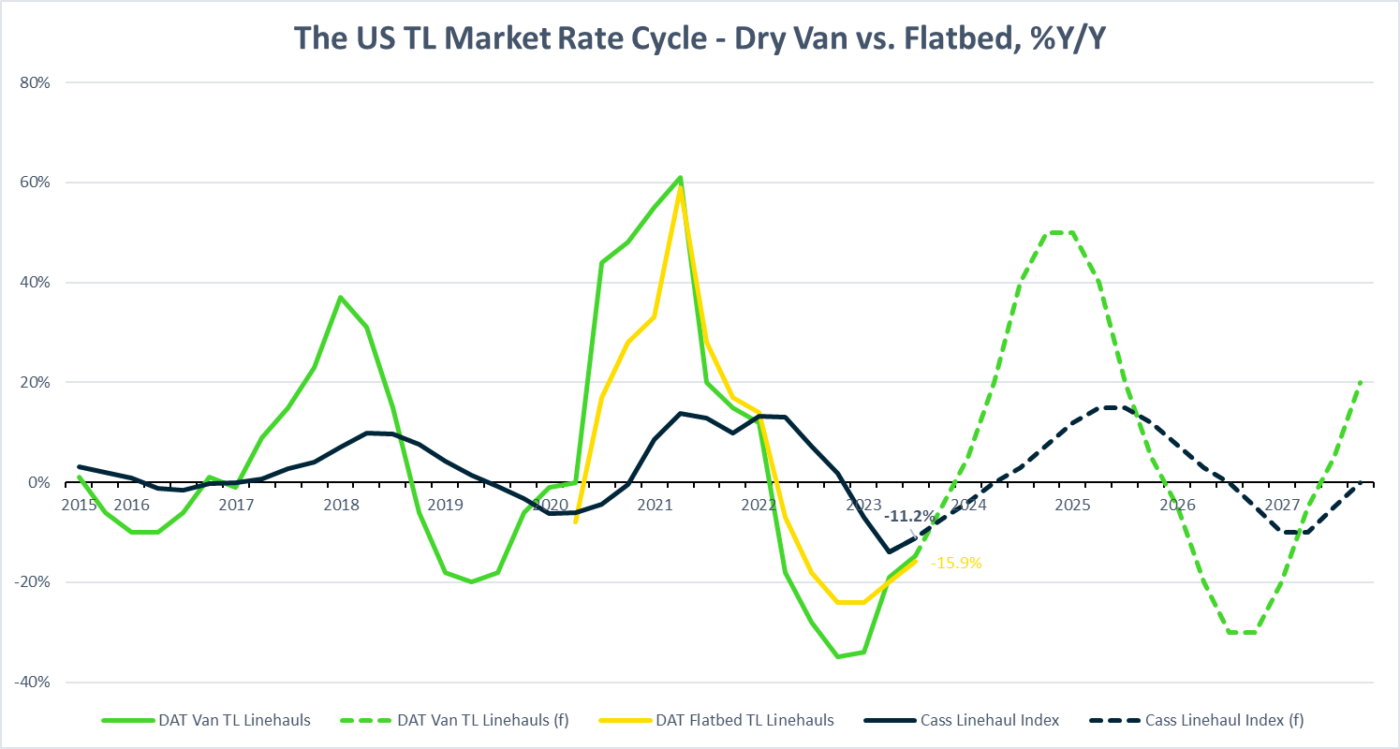
Market Capacity Cycle – Flatbed
The volume of flatbed load posts has been relatively flat since July 4, with almost no change in volume. Volumes remained around half what they were a year ago and 41% lower than in 2018.Flatbed linehaul rates in October ended where they started at around $1.89/mil. At $1.89/mile, flatbed linehaul rates are $0.19/mile lower than last year and $0.04/mile higher than in 2019.
Contributor
Mike Beckwith
Vice President, Brokerage
mbeckwith@freightplus.io
Mike Beckwith has extensive experience in freight, beginning his career 10+ years ago with Access America Transport. He has worked his way up in various leadership roles with some of the industry’s leading 3PLs. Mike has experience growing both sales and operations teams, hiring, training, and coaching. He also works part time as an educator for the University of Tennessee Chattanooga at their Southeast Supply Chain Academy, where he also serves on the board.
Contact us for more information on the domestic transportation market or if you’d like to learn more about FreightPlus.
For Shippers
Are you looking to connect with a sales representative?

